|
Summary

IntroductionGraphite web is a public web server for the analysis and visualization of biological pathways using high-throughput gene expression data. Specifically, Graphite web implement five different gene set analyses
on three organisms:
and two pathway databases:
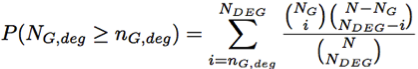
Gene set analysis backgroundThe grouping of genes into functionally related entities (gene sets) is of great help for interpreting the results obtained from gene expression experiments (microarray or RNA-seq technologies). Then, in recent years, the interest has moved from the study of individual genes to that of groups of genes (defined for instance by biological pathways). The aim of these methods is to identify groups of genes with possibly moderated but coordinated expression changes in different biological conditions, unravelling the complexity of cellular regulatory processes. Competitive vs. Self-contained In general these two approaches are based on two fundamentally different null hypotheses: the first type hypothesizes the same level of association of a gene set with the given phenotype as the complement of the gene set, the second type only considers the genes within a gene set and hypothesizes that there is no gene in the gene set associated with the phenotype (Tian et al, 2005). The main drawbacks with competitive methods are (i) the assumption that genes are independent; and (ii) the use of a cut-off threshold for the selection of differentially expressed genes. In this way, many genes with moderate but meaningful expression changes are discarded by the strict cut-off value, which leads to a reduction in statistical power. On the other hand, global and multivariate approaches relax the assumption of independence among genes belonging to the same gene sets and identify possibly moderate, but coordinated, expression changes that cannot be detected by the previous approach without depending from any arbitrary cut-offs. Given the different null hypothesis, in general competitive methods results in smaller lists of significant pathways with respect to self-contained methods. Topological vs. Non-topological The reason why the large majority of methods proposed for pathway analyses are non-topological is based on the difficulties in retrieving pathway annotation and converting pathway topology to gene network. Pathway annotation comprises chemical compounds mediating interactions and different types of gene groups (e.g. protein complexes or gene families) that are usually represented as single nodes but whose measures are not available using microarray or RNA-seq data. Then, a process of conversion from a pathway format to a gene-gene network is required to perform topological analysis. Our group has recently developed graphite (Sales, Calura et al. 2012), a Bioconductor package that taking the information from different databases, interprets pathway format and reconstruct the correspondent gene-gene networks following specific biologically-driven rules. Graphite web exploit the functions of graphite package to perform topological pathway analysis on its networks. For more details on graphite pathway conversion see Sales, Calura et al. (2012) and click here. Methods implemented in Graphite web1. Enrichment Analysis - competitive and non-topologicalEnrichment analysis (Fisher Exact test) estimates the chance probability of observing a given number of genes from a particular pathway among the selected differentially expressed genes (DEG). For each pathway a two-way contingency table is generated as follow:
Where EEG means equally expressed genes, N is the total number of
genes in the platform, G is the pathway and GC is the complement of
G. Ni and ni are the frequencies of genes
belonging to each table cell.
Then, raw p-values are adjusted using Benjamini-Hockberg method (Benjamini and Hockberg 2005). 2. Global test for group of genes - self-contained and non-topologicalGlobal test is based on a penalised logistic regression model. The idea is to find those genes within a pathway whose combination of expression profiles best predicts clinical data (samples class). In this model the dependent variable is the vector of classes and the covariates are the expression profiles of genes belonging to the pathway. In this model the total number of parameters to be estimated is equal to the number of genes in the pathways. Typically with gene expression data the number of samples is small and often happens that the number of samples would be less then the number of genes in a pathway. In this case the model is called non-identifiable, that means that we do not have a sufficient number of replicate (samples) to efficiently estimate all the parameters. To cope with this unbalance structure of the data, Goeman et al. (2004) proposed penalised regression models. In this type of models the coefficient of some genes are shrinked to zero while the remaining ones are estimated. 3. Gene Set Enrichment Analysis (GSEA) - self-contained or independent and non-topologicalGene set enrichment method (GSEA) was originally proposed by (Subramanian et al 2005). The procedure is based on the following steps:
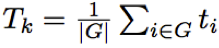
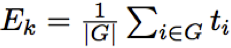
The original version of GSEA proposed to compare G and G complement distributions using a weighted version Kolmogorov-Smirnov (K-S) test, where the weights were given by the absolute value of the statistic. The significance of weighted K-S test was estimated through a permutational approach. The Authors proposed a permutation on samples in case of large sample size, and a permutation on genes otherwise. It is worth noting that the use of a permutation approach on samples or on genes changes the null hypothesis leading respectively to a self-contained or to a competitive method. Finally they normalized the weighted K-S test in order to take into account the pathway dimension. However, it was shown (Tian et al. 2005) that the differences in the correlation structure of each pathway could lead to a biased comparison among gene sets unless a normalization procedure is applied. To cope with this problem Tian et al. (2005) proposes the use of the standard statistical approach for comparing mean shift of the G and the G complement distributions: a one sample z-test with a permutational approach. Given ti the statistic of the gene i with i=1… N where N is the number of genes in the platform, the two statistics proposed by Tian et al. (2005) are:
with its null distributions generated by permuting ti,…, tn; and
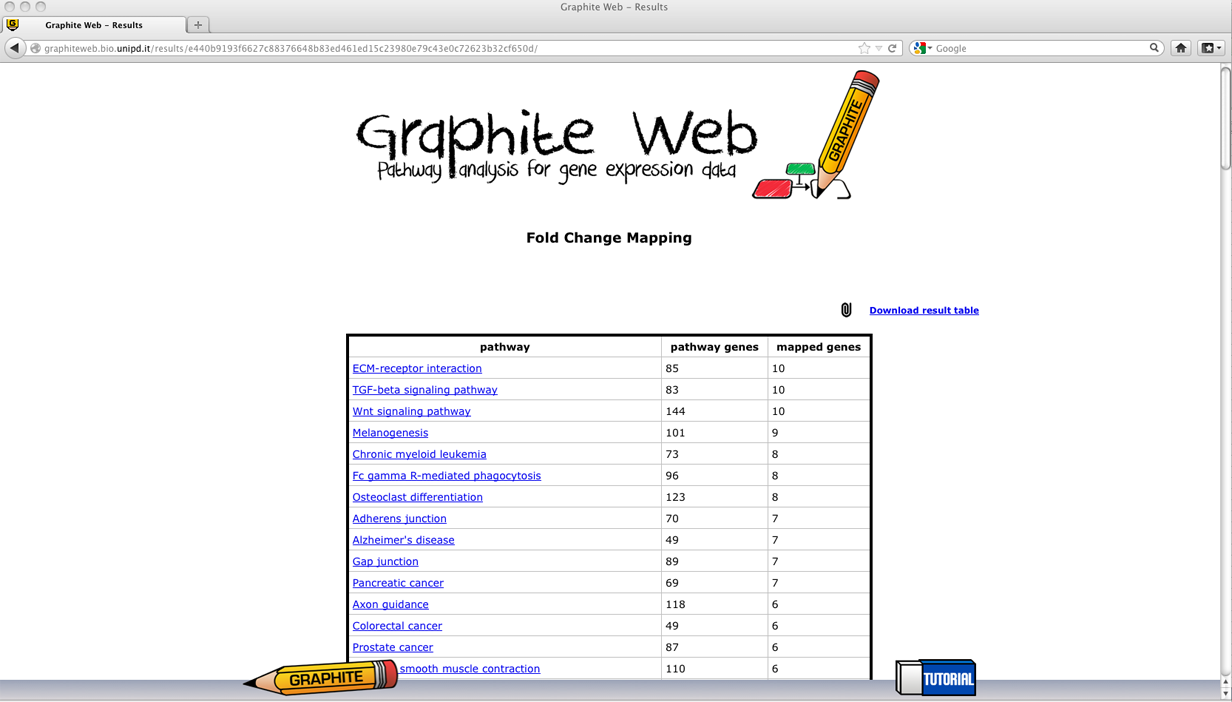
with its null distributions generated by permuting samples. Then after a process of standardization Ek and Tk become z-test and are called NTk and NEk statistics. However the correlation structure in gene sets can still give false positives in NTk; conversely, NEk can still be influenced by the gene set size. Then Tian et al. (2005) suggest taking as good candidates pathways significant either for NTk or NEk. Graphite web implements Tian et al (2005) GSEA statistics. 4. Signalling Pathway Impact Analysis (SPIA) - mixed and topologicalThe method proposed by Tarca et al. (2009) calculates a score through the combination of several aspects of the data: the fold change of DEGs, the pathway enrichment score and the topology of signaling pathways. Specifically, from a topological point of view SPIA enhances the impact of a pathway if the DEGs tend to lie near its entry points of a pathway (an entry point id a gene upstream of the pathway). SPIA needs as input the list of differentially expressed genes with their log fold changes and the complete list of gene names in the platform. Then, SPIA calculates 1) the hypergeometric enrichement p-values, pNDE, (as described before), and 2) a perturbation factor as a linear function of the perturbation factors of all genes in a given pathway, whose significance is calculated through a bootstrap approach, pPERT (note: the parameter of the linear combination are not estimated from the data but are fixed as +/-1 according to the interactions pathway annotations) and 3) the combination of the two independent p-values, pNDE and pPERT, called pG. Adjusted pG were calculated using popular FDR algorithm (Benjamini and Yekutieli, 2001). According to the sign of the perturbation score the pathway is defined as activated (positive perturbation score = positively perturbed) otherwise the pathway is inhibited (or negatively perturbed). 5. Pathway analysis through Gaussian Graphical Models (CliPPER) - self-contained and topologicalCliPPER (Martini et al. 2012) is an empirical method based on Gaussian graphical models that (i) selects pathways with covariance matrices or means significantly different between experimental conditions; and (ii) on such pathways, identifies the portions of the pathways, called signal paths, mostly associated to the phenotype. Different experimental conditions are usually compared in terms of their gene expression mean differences. However, the difference in mean expression levels does not necessarily result in a change of the interaction strength among genes. Suppose to have in condition 1 transcript A and B, and their mean expression, respectively xa and xb. Suppose, now, that in a condition 2 the expression of A and B are both 10 fold increased (10*xa and 10*xb). Then, we have a proportional increase of the expression of both A and B. In this case, the mean expressions of A and B will be significantly different between the conditions 1 and 2 but the correlation strength between A and B won't change. In this case, we will have pathways with significant altered mean expression levels but unaltered biological interactions. On the contrary, if transcripts abundances ratios are altered, we expect a significant alteration not only of their mean expression levels, but also of the strength of their connections, resulting in pathways with completely corrupted functionality. Suppose that in condition 3 the expression of A and B increase without proportionality (say respectively 10 fold and 2 fold), then, we will have that not only the mean but also the correlation will be significantly different in the condition 1 and 3. Therefore, to look for pathways strongly involved in a biological process, CliPPER is the first method that 1) selects pathways with mean or variance significantly altered and then 2) highlights the portions, called signal paths, of a pathway mostly correlated with the phenotype. Sample AnalysesGraphite web has two sections. In the Browse section the user can visualize and map a list of genes (possibly coloured according to a fold change), in the Analyse section the user can perform pathway analysis using gene expression matrices. "Browse" session for gene mapping and pathway visualization
A list of genes provided by the user will be mapped on all the pathways of the selected database.
The resultsThe results are divided into two web pages reporting:
Analysis
For Enrichment score and SPIA, which require Differentially Expressed Genes (DEGs), two procedures are possible, depending if the user has already computed the Differentially Expressed Genes (DEGs):
Global test, GSEA and CliPPER require a single expression normalized matrix:
Download sample files for Enrichment score and SPIA and for Global test, GSEA and CliPPER. Sometime the analysis could take several minutes to complete. Thus, we suggest the user to give us his email to receive an alert when the analysis is completed.The resultsThe results are divided into two web pages reporting:
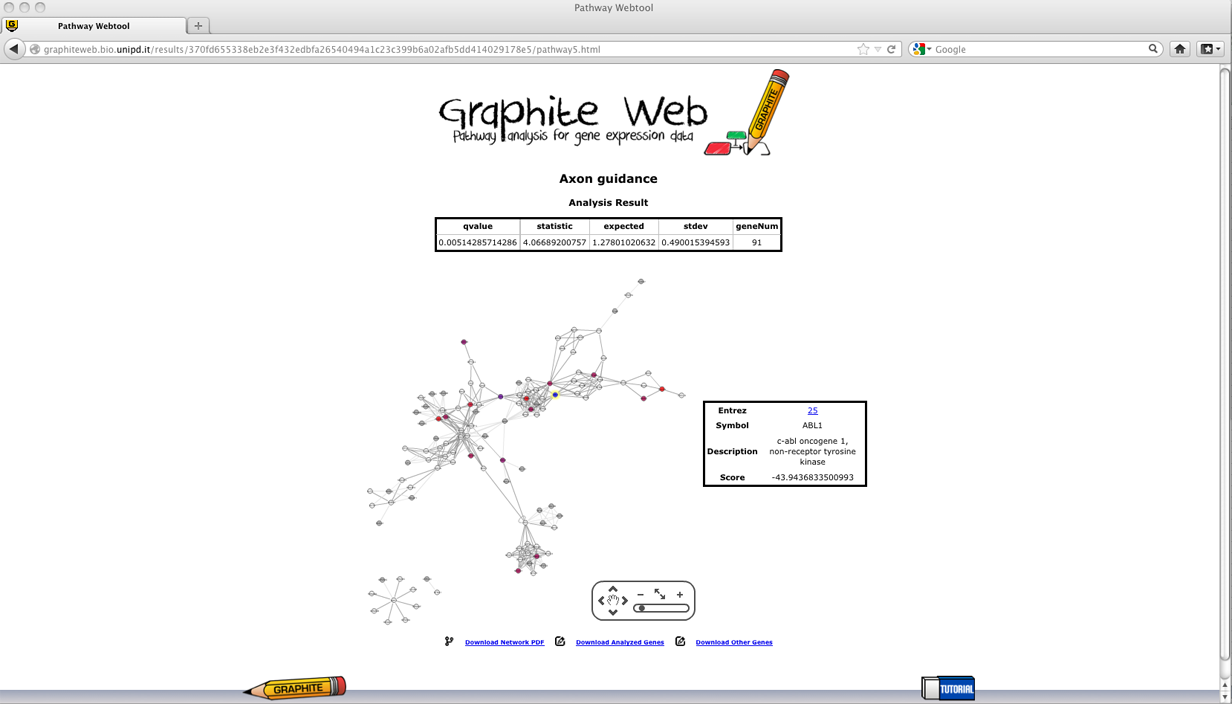
In the following we report a detailed description of the results for each method. Enrichment Analysis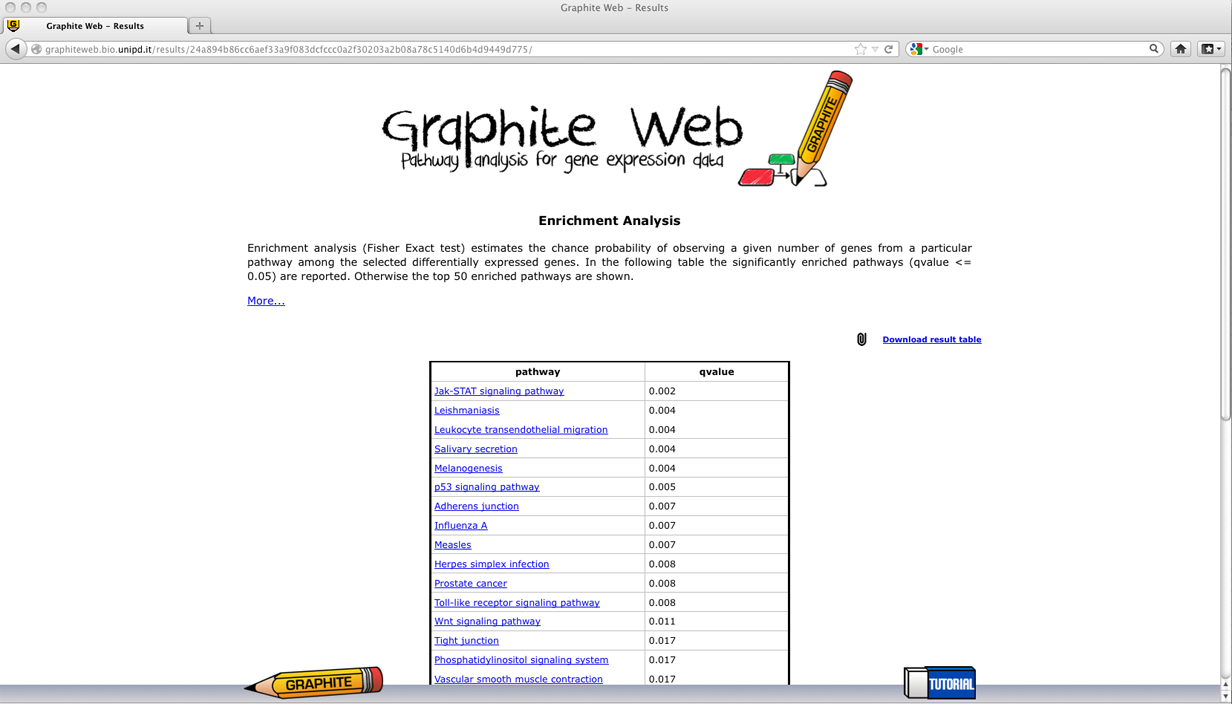
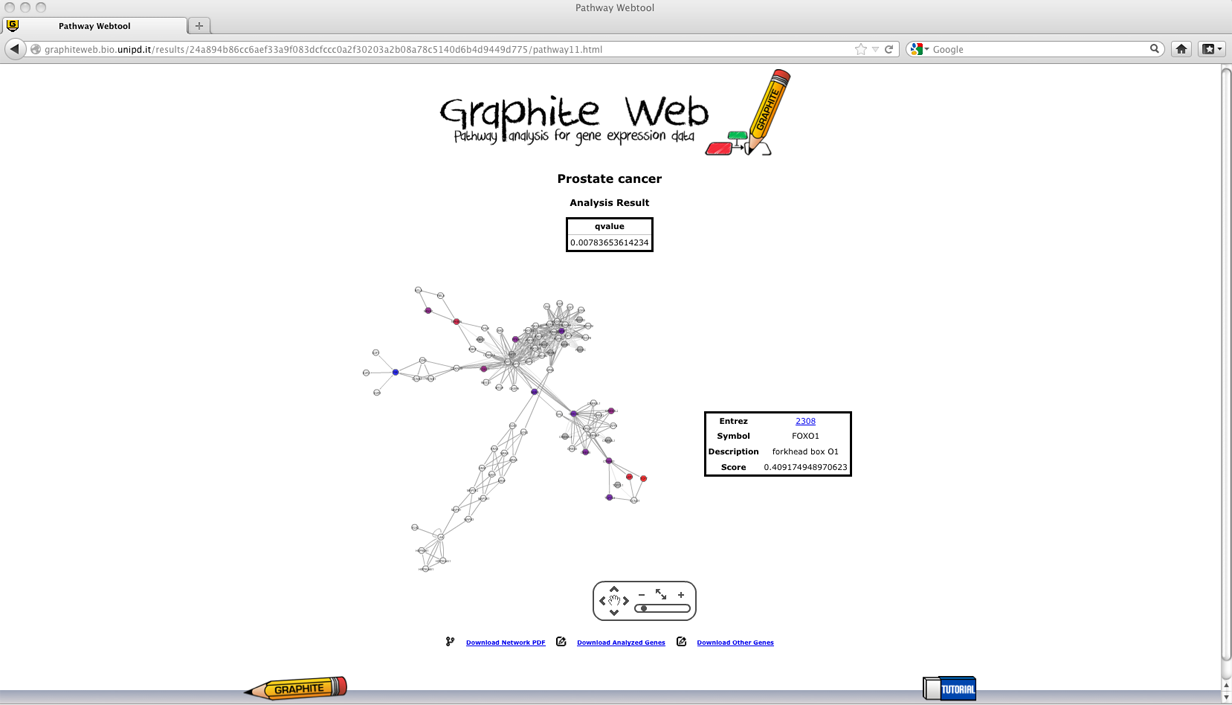
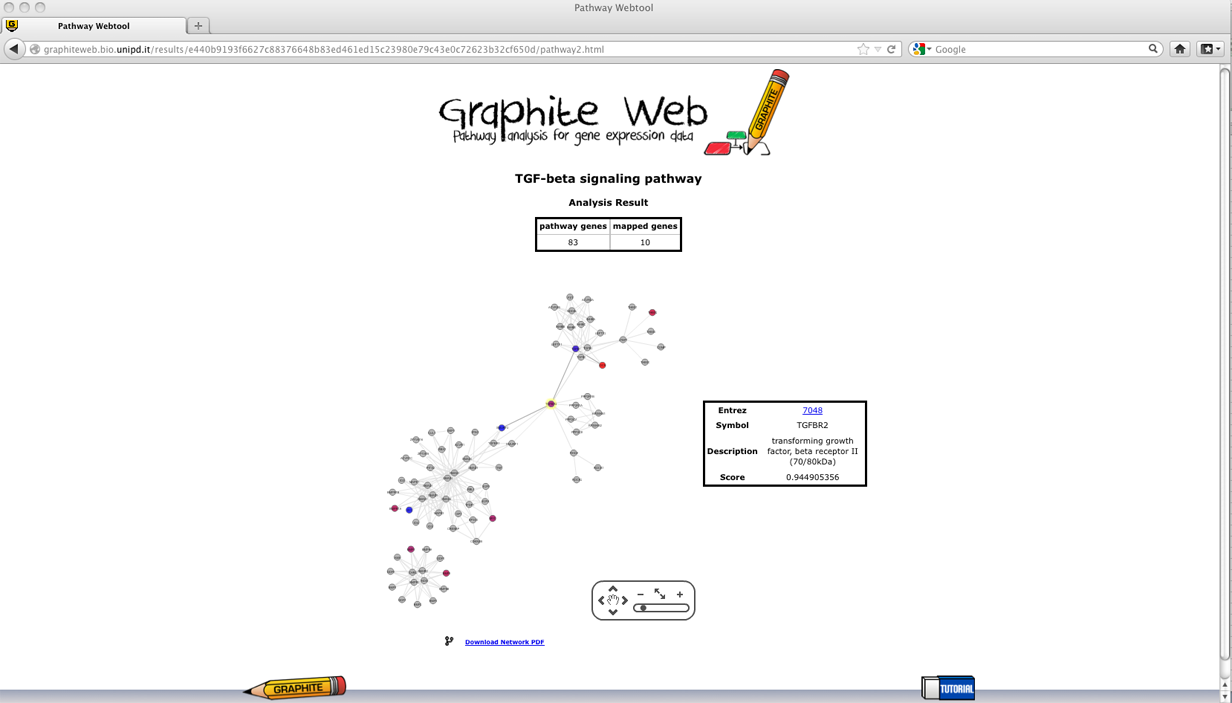
Pathways with adjusted p (qvalues) less than 0.05 are reported in the first table. Then clicking on a pathway, the network-based visualization of the pathway is available as an interactive tool. Grey nodes are genes not available in the platform, white nodes correspond to genes not differentially expressed, and coloured nodes are genes differentially expressed (as reported by the user) with colour proportional to the log fold change, as shown in palette. Global test for group of genes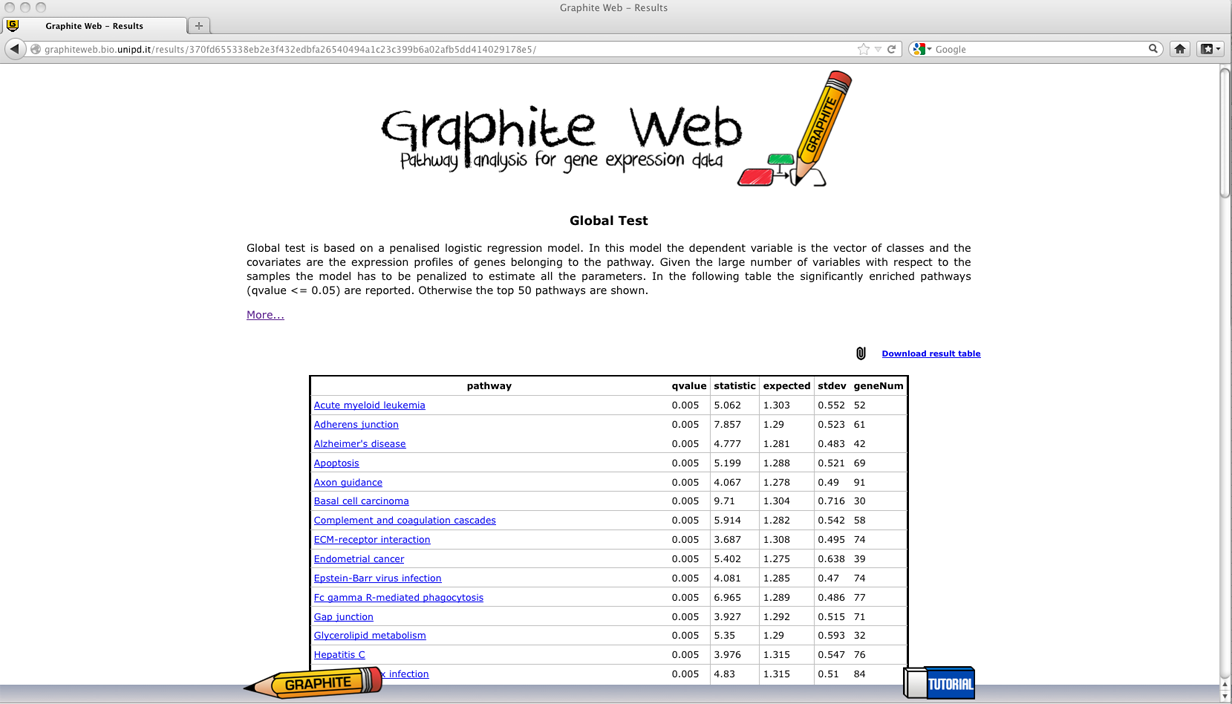
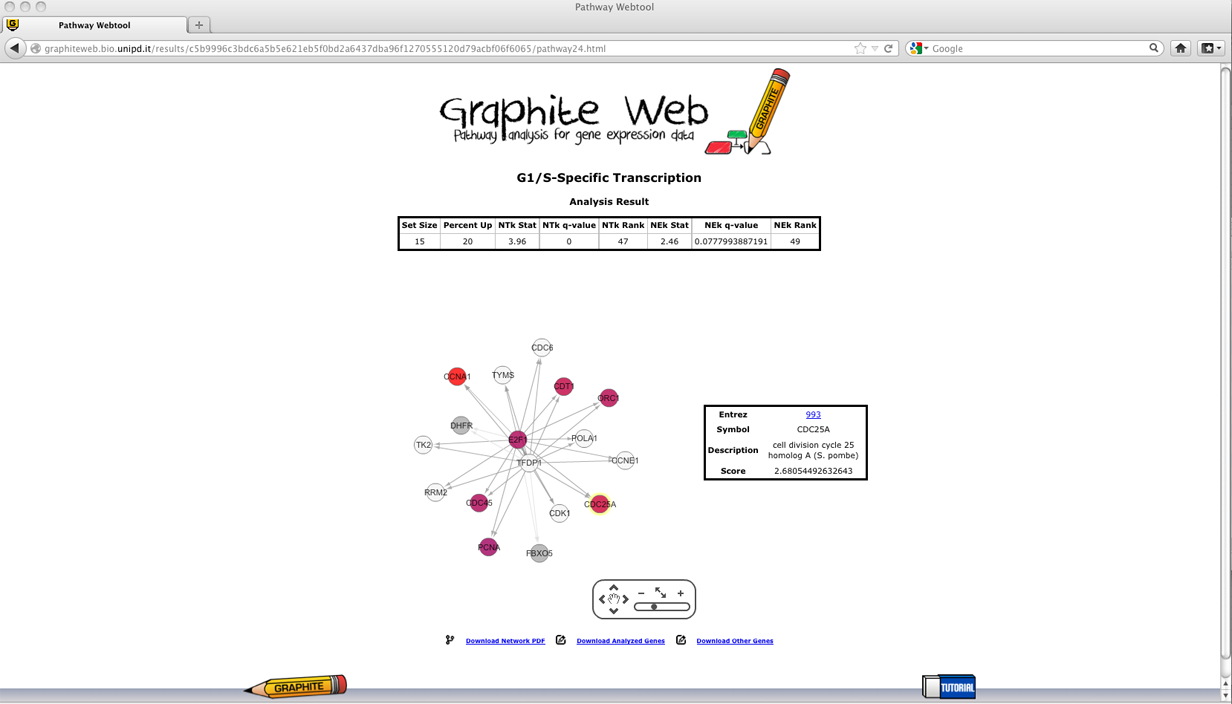
A table with all the significant pathways is reported (a significant pathway has qvalue<= 0.05). In the following a detailed description of each column:
Then clicking on a pathway, the network-based visualization of the pathway is available as an interactive tool. Grey nodes are genes not available in the platform, colour nodes are the subset of genes that is most responsible for the significant test result, and white nodes are genes whose contribution is negligible. Since the global test statistic on a collection of genes can be seen as a weighted average of the global test statistics for each individual genes, the contribution of each gene is estimated using global test on each individual gene. In Graphite web only genes with individual global test p-value <= 0.05 are coloured proportionally to the value of its statistic, as shown in palette. Gene Set Enrichment Analysis (GSEA)
A table with all the significant pathways is reported (qvalue<= 0.05). In the following a detailed description of each column:
Then clicking on a pathway, the network-based visualization of the pathway is available as an interactive tool. Grey nodes are genes not available in the platform, coloured nodes represent individual genes with p-value of the t-test statistic <= 0.05 (that contribute mostly to the significance of the pathway) and the colour is proportional to the value of the statistic, as shown in palette.
Signalling Pathway Impact Analysis (SPIA)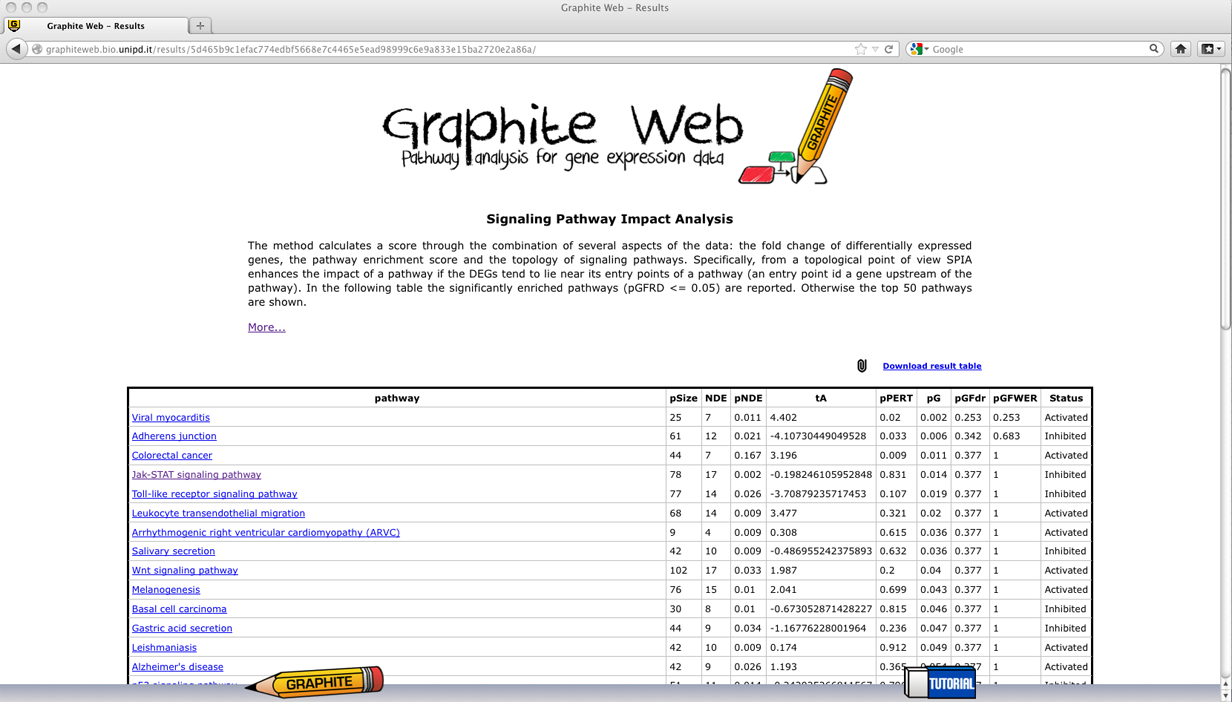
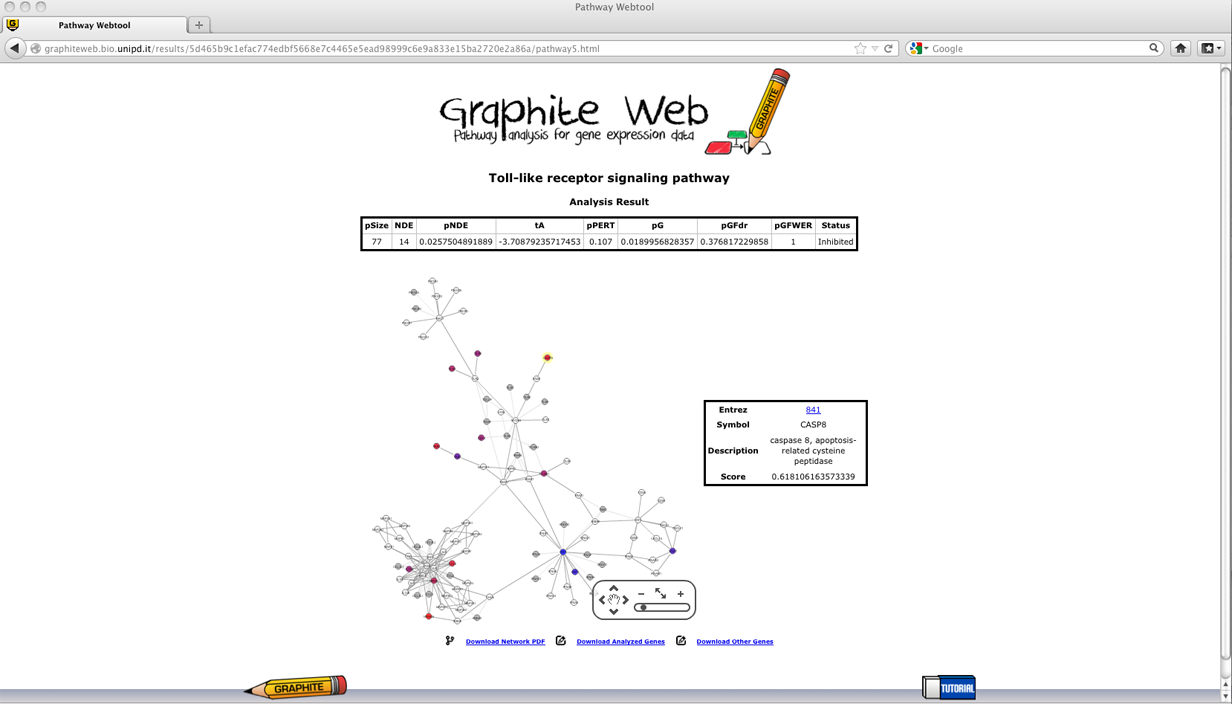
A table with all the significant pathways is reported (qG<= 0.05). In the following a detailed description of each column:
Then clicking on a pathway, the network-based visualization of the pathway is available as an interactive tool. Grey nodes are genes not available in the platform, white nodes correspond to genes not differentially expressed, and coloured nodes are genes differentially expressed (as reported by the user) with colour proportional to the log fold change uploaded, as shown in palette. Pathway analysis through Gaussian Graphical Models (CliPPER)
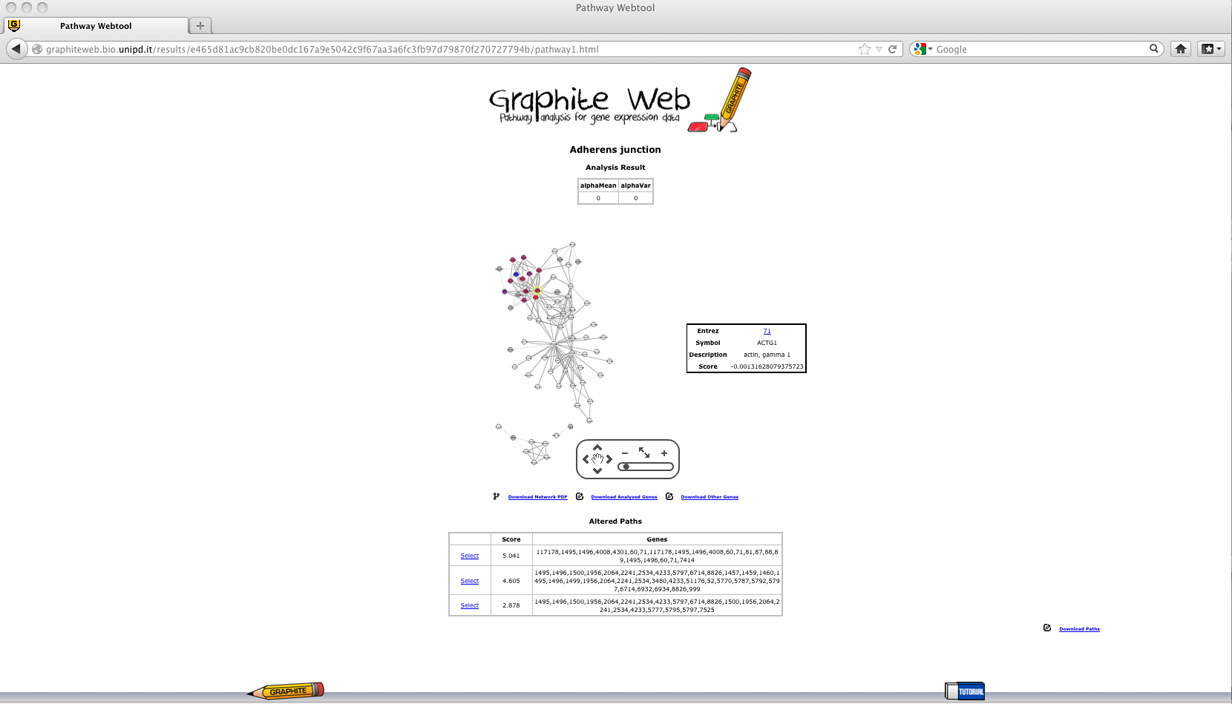
A table with all the significant pathways for the mean and for the concentration matrices is reported (significant pathway must have both p-values <= 0.05). In the following a detailed description of each column:
between groups. Note that according to the value of alphaVar the test on the means is different; if alphaVar is less than 0.05 the test on the means does not assume homoscedasticity. CliPPER is the first method that given a pathway is able to select the portions of the pathway mostly associated to the phenotype. Then clicking on a pathway Graphite web returns:
Clicking on each paths, the genes belonging to the path are highlighted according to their log fold changes, as shown in palette. Download sessionsFor each significant pathway Graphite web allows the download of:
Furthermore the complete results of Graphite web for all the significant pathways can be downloaded as a single zip file. In case of large pathways, the visualization with Cytoscape web will be too heavy, then Graphite web provide the sif file necessary for a in-house visualization.
Some important referencesPathways conversion to gene-network SPIA GSEA Global TEST CliPPER REVIEW AND DISCUSSION |